Research-stage medical imaging workbench
Turn anonymized MRI and CT into organ measurements researchers can trust. Kidney and liver volumes, body composition, and longitudinal growth.
TraceOrg helps researchers generate MRI and CT volume reports from anonymized studies, including organ measurements, longitudinal tracking, and workflow-specific imaging analysis.
Research use only. Not for clinical decisions.
- NIDDK-supported
- Grant 1U54DK144866-01
- Versioned workflows
- Every run pinned to a version
- Per-job audit trail
- Inputs and outputs tracked
- Research-only
- Anonymized studies
Research workflows
Research-stage imaging workflows for volume reports and longitudinal follow-up.
Cardiothoracic Ratio (CTR)
Measure CTR from chest CT or MRI by comparing the widest horizontal diameter of the heart with the width across both lungs.
Liver Fat Fraction Workflow
Measures liver fat fraction from qualified PDFF, Dixon water/fat, or in-phase/opposed-phase MRI series using a dedicated liver analysis service.
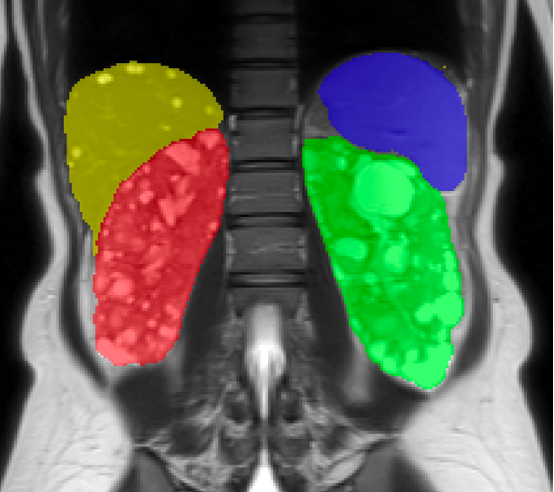
PKD Workflow
Measure kidney and cyst volumes, classify Mayo class 1A-1E, and track growth over time for PKD.
How it works
Four steps from scan to expert review
Upload
Upload anonymized abdominal MRI and CT studies, DICOM or NIfTI format, drag-and-drop.
Label
AI labels organs and tissues.
Calculate
Volumes, QA checks, and biomarkers for expert review.
Report
Download shareable volume reports with longitudinal tracking across visits.
News & Research
Latest updates, research findings, and tutorials from our team
Reassessing the Cardiothoracic Ratio (CTR): From a Chest X-ray Index to Opportunistic Cardiac Screening on Abdominal MRI in ADPKD
The cardiothoracic ratio is a century-old chest X-ray index of heart size. Recent work (Shen et al., JMRI 2026) shows it can be measured directly on the abdominal MRI that ADPKD patients already undergo for kidney-volume monitoring, to identify left ventricular hypertrophy. This article reviews the measurement and diagnostic performance of the CTR, focuses on its value for opportunistic cardiac screening in ADPKD, and discusses the shift toward automated, quantitative imaging.
How to Use TraceOrg for Liver Fat Fraction: MRI-PDFF, Fatty Liver, and GLP-1 Monitoring
Learn how TraceOrg measures liver fat fraction from MRI-PDFF, Dixon water/fat, and fallback sequences, with RSNA/QIBA reference bands for MASLD/NAFLD and GLP-1 or weight-loss monitoring.
How to Use TraceOrg for PKD: TKV, Mayo Class, and Kidney Volume Tracking
A plain-language guide to PKD imaging terms, including TKV, htTKV, Mayo Imaging Classification, longitudinal tracking, and how to prepare imaging files for TraceOrg.
How TraceOrg Tracks Kidney Volume Over Time
Learn how TraceOrg's PKD longitudinal plot shows kidney volume changes across multiple studies, how to read before and after transition trends, and how the annual growth line is estimated.
Supported By
National Institute of Diabetes and Digestive and Kidney Diseases (1U54DK144866-01)